Thursday, December 2, 2021

Re-implementing the upload of images for the LaTeX→HTML converter

The CDLI is developing a new website. That website’s admin interface for its journals contains a page where a LaTeX source file, following a specific template, is configured to an HTML page. For this, apart from the LaTeX file itself, two additional components are needed: a BibTeX file, containing metadata of the references; and image files.

Current implementation

The current implementation involves uploading images separately from the form that creates the article. This can lead to “orphan” images if such a form is abandoned after uploading the images. The current implementation has an additional problem, where files are saved in a single directory, so multiple images with the same file name (say, Figure1.jpg) will overwrite previous images.

ClientServerGET /admin/articles/add/cdlj200 (add page)POST /admin/articles/convert-latex200 (converted HTML, list of images)POST /admin/articles/image 'Figure1.jpg'Saves image in 'Figure1.jpg'200POST /admin/articles/add/cdlj300 /articles/<sequential ID>ClientServer

New implementation

With a new implementation of the rest of the forms, simplifying a lot of the code, the issues with the image uploads are also attempted to be resolved.

Saving images together with the metadata

To avoid the problem of the “orphan” images resulting from abandoned forms, one could submit the images in the same form that creates the article. If that form is not submitted, or contains invalid data so cannot be saved, the images will not be uploaded.

Saving images according to metadata

The second problem could be solved immediately by saving the images in subdirectories according to the metadata of the image, e.g. 2021-01/ where 2021 is the year the article is published and 01 is the article sequence number within that year. This however assumes that that metadata does not change after the initial submission.

Both these solutions however creates some constraints on other problems, because it means that the images can only be saved after the user submits the main form, so after the HTML containing <img> elements with references to the image locations is generated. Somehow, those image locations should be able to identify the article, before any information about that article is known:

ClientServerGET /admin/articles/add/cdlj200 (add page)POST /admin/articles/convert-latexAt this point the HTMLshould contain linksto the permanent locations of the images200 (converted HTML, list of images)POST /admin/articles/add/cdljAt this pointthe images are savedin a permanent location300 /articles/<sequential ID>ClientServer

So, what is the solution? I propose the following:

ClientServerGET /admin/articles/add/cdljGenerate random article ID200 (add page with embedded article id)POST /admin/articles/convert-latexGenerate image URLSaccording torandom article ID200 (converted HTML, list of images)POST /admin/articles/add/cdljVerify random article ID,save images,generate sequential ID300 /articles/<sequential ID>ClientServer

Monday, March 29, 2021

CDLI catalogue growth over time

Since Google Summer of Code 2020 I have been contributing code to the new framework of the Cuneiform Digital Library Initiative (CDLI), a digital repository for metadata, transliterations, images, and other data of cuneiform inscriptions, as well as tools to work with that data.

One of the features of the new CDLI framework is improved editing of artifact metadata, as well as inscriptions. There are several ways artifacts will be able to be edited: by uploading metadata in a CSV-format, by batch edits in the website interface, and by editing individual artifacts. At the basis of all those pathways is the database representation of individual revisions. To evaluate the planned representation, and to see if alternatives are possible, I took a look at the catalogue metadata (CDLI 2021), and what edits are being made currently.

Artifact registrations


Figure 1: The number of artifacts registered each year, split by the collection they are in. Collections with less than 7000 artifacts represented are combined into the “Other” category to keep the legend manageable. 13K artifacts without valid creation dates were excluded.

First, I took a quick look at the composition of the catalogue (Fig. 1). As it turns out some collections had most of their (included) artifacts added in a single year, such as the University of Pennsylvania Museum of Archaeology and Anthropology in 2005 and the Anadolu Medeniyetleri Müzesi in 2012. Other collections seemed to have had a more steady flows of artifact entries, particularly the British Museum. Overall, this does not help much with selecting a database representation of revisions though.

One of the options we want to evaluate is storing revisions in a linked format, similarly to how artifacts are stored now, instead of a flat format. This means that if each of those artifacts has about 10 links in total — say 1 material, 1 genre, 1 holding collection, 1 language, 1 associated composite, and 5 publications — each revision would need 10 rows for the links and 1 row for the rest of the entry. Therefore, the question is: are 11 rows per revision manageable for 343,371 active artifacts?

Revisions

To find out, let’s take a look at the daily updates of the catalogue data. With the git history, we can find out how many artifacts were edited on each day. Since the commits are made daily multiple consecutive edits to the same artifact are counted as a single revision. On the other hand, the removal of an artifact from the catalogue might be counted as a revision. Whether that balances out is hard to tell, so these numbers are a rough estimate. The analysis only goes back to 2017 unfortunately, as before that the catalogue was included as a ZIP file.


Figure 2: Number of artifact revisions per year. The 12 largest revisions are highlighted and explained below.

Figure 2 highlights in various colors the 12 revisions affecting the highest number of artifacts. Most of these are 7 consecutive in October and November of 2017. These involved editing the ID column, something which should not happen in the current system. Other large revision usually affected a single column, thereby revising almost every artifact:

  • Padding designation numbers with leading zeroes (“CDLI Lexical 000030, ex. 13” → “013”): 2020-02-11, 2018-01-26
  • Addition of new columns: 2019-09-10
  • New default values ("" → “no translation” for the column translation_source): 2018-10-30

Outside the top 12 the edits become a lot more meaningful. Often, credits for new transliterations or translations are added, sometimes with the previously undetermined language now specified.

As it turns out, approximately 3 million edits are made every year. If all those edits are stored as linked entities, we are looking at 30 million table rows, per year. However, even if the edits are stored in a flat format there would be 3 million table rows per year already. Either option might become a problem in 5–10 years, depending on SQL performance. With indexing it might not be a problem at all: usually the only query is by identifier anyway.

Changed fields

That said, let’s presume I choose the flat format. Most revisions only change one or two fields (excluding the modification date which would not be included). Duplicating the whole row might be wasteful, so what could I do to avoid that?

Since the flat format is based on the schema of the CSV files used for batch edits, each column can be considered as text, with an empty string for empty values. This leaves NULL (i.e. “no value”) available to represent “no change”. Together with MySQL’s SPARSE columns only edited fields would be stored. (Otherwise, each empty value would need to be signified as such. Now, actual values carry some extra information to the same end.)

It would also make it even easier to display a list of changes, as there is no need to compare the value with the previous one. Other operations with revisions, such as merging two revisions made simultaneously on the same version of an artifact, would be easier for the same reason.

Since this would not be possible, or not as easy, with a linked format perhaps it was good the shear volume of edits pointed me that way anyway.

References

Cuneiform Digital Library Initiative. (2021, March 8). Monthly release 2021.03 (Version 2021.03). Zenodo. http://doi.org/10.5281/zenodo.4588551

Friday, March 26, 2021

GitHub pages 404 redirection

Recently I moved the Citation.js API documentation from /api to /api/0.3, to put the new documentation on /api/0.5. I fixed all the links to the documentation, but I still got a issue request regarding a 404 error after just a few days. All in all, I had to redirect pages from /api/* to /api/0.3/* while all these pages are hosted as static files on GitHub Pages.

There are three ways I found to do this:

  1. I make otherwise empty HTML files in /api/* that redirect to /api/0.3/* via JavaScript or a <meta> tag.
  2. I make use of jekyll-redirect-from. This is equivalent to option 1, I think.

Option 1 seemed like a hassle and I do not use Jekyll so option 2 seemed out of the question as well. However, we still have option 3 to consider:

  1. I add a 404.html to the repository which gets served automatically on a 404. It then redirects to /api/0.3/* with JavaScript, and gives guidance on how to find the new URL manually if JavaScript is disabled.

404.html is just a normal 404 page with 4 lines of JavaScript:

var docsPattern = /(\/api)(\/(?!0.[35]\/)|$)/  
  
if (docsPattern.test(location.pathname)) {  
    location.pathname = location.pathname.replace(docsPattern, '$1/0.3$2')  
}

Breaking down the RegExp pattern:

  • (\/api) matches “/api” in the URL
  • (\/(?!0.[35]\/)|$) matches one of two things, immediately after “/api”
    • Either $, the end of the string (like “https://citation.js.org/api” without the trailing slash)
    • Or \/(?!0.[35]\/), which matches a forward slash ("/api/") followed by anything except “0.3” or “0.5”. This is to avoid matching things like “/apical/” or “/api/0.3/does-not-exist”.

This is not the neatest solution but I like it conceptually. It shows a bit of potential for Single-Page Applications as well: you can serve the same HTML+JavaScript for every possible path without having to rely on URLs like https://example.org/#/path/page. The problem is that you still get the 404 HTTP status (as you should), so if a browser or search crawler decides to care you have a problem.

Try it out now: https://citation.js.org/api/

The new "Page not Found" page in the same style as the homepage.

Wednesday, February 24, 2021

Mid-week effect of Dutch COVID-19 case reporting

Every week since the start of January I heard headlines like “3963 new infections, a bit more than average”. In context, that meant that the amount of positive COVID-19 that day was higher than the average daily amount of cases in the previous seven days. Even though we heard that every week, overall the cases were going down. What was going on? Well, somewhat unsurprisingly, the amount of reported cases was higher on weekdays than on Monday and in the weekend. The news site I linked above mentions the midweek-effect as well, but on Twitter and on the radio you mainly hear the headline, not the caveats.

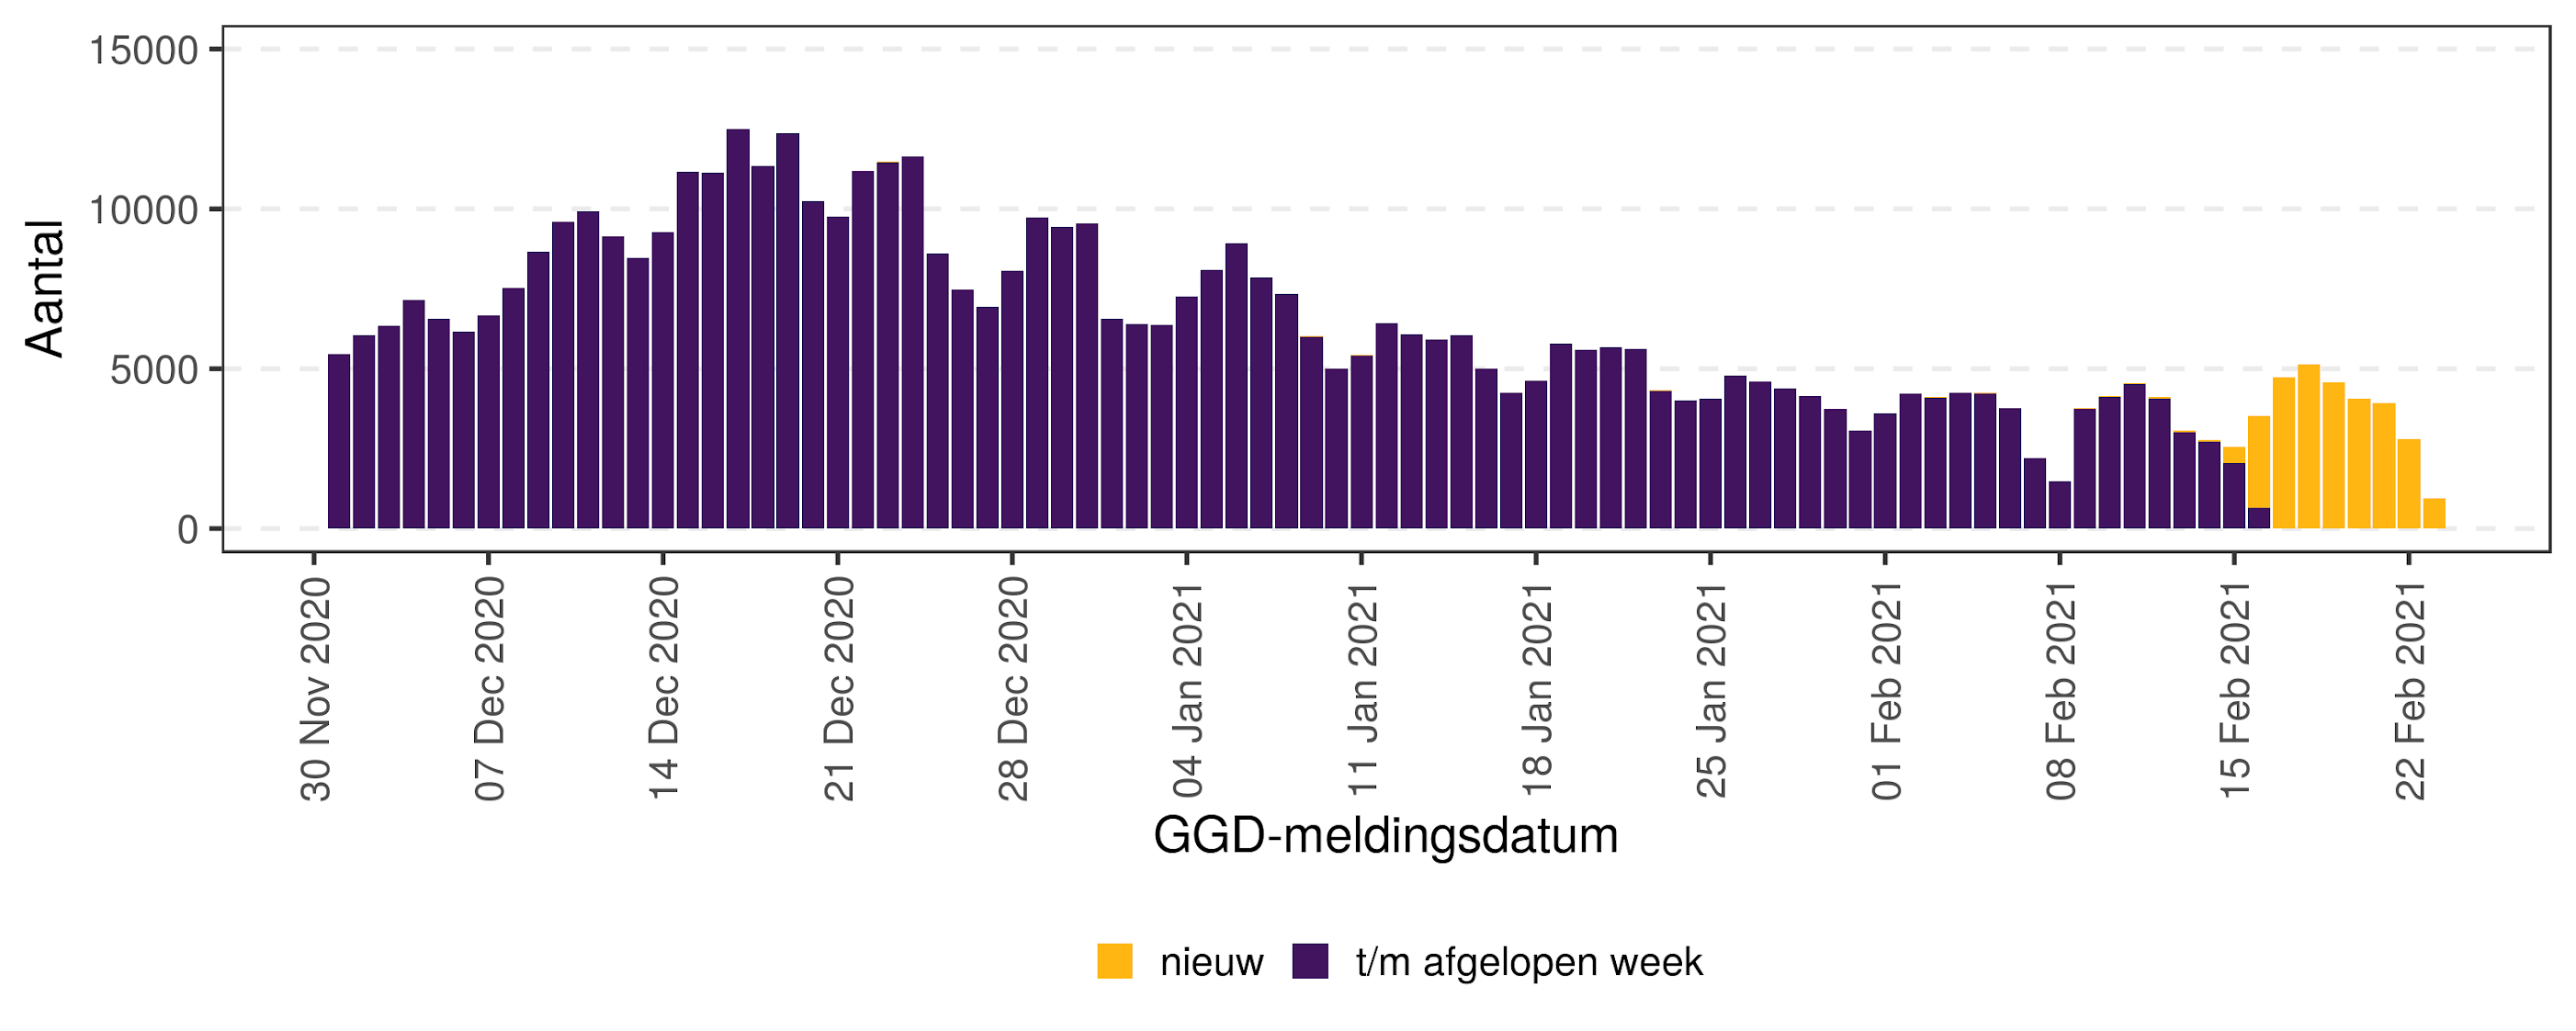
Anyway, I wanted to see what the midweek-effect actually looked like. The daily infection data is available from the RIVM website, RIVM being the Dutch National Institute for Public Health and the Environment. I started by reproducing the graph they made, partly to check the file and partly for fun (see Fig. 1).

Amount of new cases on each GGD notification date
Figure 1: Amount of positive COVID-19 tests since the start of December. The date used is the date when the test result was reported to the GGD, the municipal health service. In yellow are the test results RIVM got this week, in purple previous data.

To decompose the various effects in this data, I used R’s stats::stl() function on a time series with frequency=7. This took a while to figure out, as a mis-configuration on my end of the time series led to STL interpreting each day as a season, instead of each week. Because the seasonal effect is multiplicative and not additive, I had to log-transform the data as well. This means the seasonal component has a higher amplitude when the overall amount of cases is higher (see Fig. 2).

Seasonal component and trend of data previously shown
Figure 2: Weekly component and general trend of positive COVID-19 tests, overlayed on daily data. The solid line indicates the overall trend, while the dashed line combines the overall trend with the seasonal component. Yellow still indicates test results from this week, purple the previous data.

In the end, this does not mean much at all. The accepted explanation of the midweek-effect has to do with when tests are carried out and reported; not when infections actually take place. If we look at the cases where the date of disease onset is available (source, Public Domain Mark 1.0), the weekly trend is less present (see Fig. 3).

Seasonal component and trend of new cases per day of disease onset
Figure 3: Number of new confirmed cases per day of disease onset. The solid line indicates the overall trend, while the dashed line combines the overall trend with the seasonal component. The gray area show daily cases.

Comparing the two weekly trends, the midweek-effect of reported cases is higher than the weekly effect of the disease onset of cases. In addition, the latter peaks on Mondays and declines throughout the week before as opposed to the midweek-effect (see Fig. 4). Whether this effect is actually present or another artifact of data reporting is unclear to me.

Weekly pattern of GGD test results and reported disease onsets
Figure 4: Weekly component of reported cases and disease onsets. The solid line shows the pattern for the day of disease onset, the dashed line for the day when the test result is reported.